The immune system is composed of a variety of cell types each with unique roles and functions. These different cell types can be identified by a unique signature of cell-surface proteins called CD (cluster of differentiation) markers. Well known examples of CD markers are CD4 and CD8, which are used to identify T lymphocytes involved in regulating the adaptive immune response. CD markers for flow cytometry are used in many applications, including immunophenotyping (see below).
The CD nomenclature has been developed and maintained by the HLDA (Human Leukocyte Differentiation Antigens) workshop. This initiative, starting in 1982, originally aimed to classify the monoclonal antibodies (mAbs) raised against cell surface molecules of leukocytes being generated by laboratories worldwide. The proposed marker is assigned a CD number once two specific mAbs have been shown to bind to it. Markers that are not sufficiently characterized are labeled with a provisional “w” (as in “CDw145”).
There are now over 370 CD unique clusters and subclusters described in humans, including cell types other than leukocytes. CD antibodies are used widely for studying cell structure, function and distribution in research, differential diagnosis, and monitoring and treatment of disease (Table 1).
CD markers from Leinco Technologies
Leinco Technologies provides labeled antibodies for a wide range of human and mouse CD markers for flow cytometry:
Examples of CD Markers
| Marker | Cell Type |
|---|---|
| CD2, CD3, CD4, CD5, CD7, CD8 | T cells |
| CD10 | Early pre-B cells (immature B cells) |
| CD11c, CD25, CD103, CD123 | Hairy cell leukemia cells |
| CD13, CD33, CD117 | Myeloid cells |
| CD14, CD64 | Monocytic cells (positive in AML-M4 and AML-M5) |
| CD15 | Reed-Sternberg cells, neutrophils |
| CD16, CD56 | Natural killer cells |
| CD19, CD20, CD21, CD22 | B cells |
| CD23 and CD5 | Chronic lymphocytic leukemia/small lymphocytic lymphoma |
| CD31 | Endothelial cells (positive in angiosarcoma), megakaryocytes and platelets |
| CD33 | Myeloid cells and precursors |
| CD34 | Stem cells (also positive in angiosarcoma) |
| CD41, CD61 | Megakaryocytes and platelets (positive in AML-M7) |
| CD45 | All leukocytes (except Reed-Sternberg cells) |
| CD45 RO | Memory T cells |
| CD45 RA | Naive T cells |
| CD56 | Natural Killer (NK) cells |
| CD79b | B cells, plasma cells, and lymphoproliferative disorders |
| CD200 | A useful marker to differentiate between CLL (positive) and MCL (negative) |
Table 1.
See a full list of CD markers for flow cytometry
Applications for CD markers
Immunophenotyping
Immunophenotyping is a powerful tool that uses flow cytometry to gain insight into the composition and dynamics of cell populations in an immune response. The technique involves identifying cell types in heterogeneous cell populations by using different fluorescently-tagged antibodies that target various CD markers. Different combinations of antibodies can be used to identify different groups and sub-groups of cells. For example, CD3 can be used as a general marker for T cells followed by other CD markers to identify regulatory T cells (CD4 and CD25), T helper cells (CD4), and cytotoxic T cells (CD8). Immunophenotyping can be used for discovery and can also be applied in clinical settings, for example to help diagnose and classify a leukemia or lymphoma, or refine the analysis of cancer cell lines by determining the presence or absence of cancer cell markers that correlate with different degrees of severity.
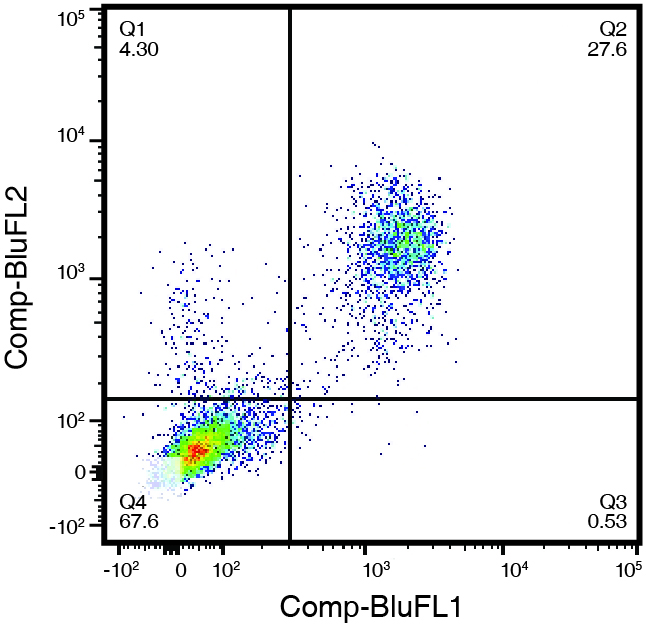
Figure 1. (right) Human peripheral blood leukocytes, stained with CD3-FITC (Clone UCHT-1) and CD5-PE (Clone UCHT-2). Double positive cells in the upper right quadrant represent 27.6% of the cell population, while 67.6% were negative for both CD5 and CD3 (lower left quadrant).

Immunohistochemistry
Many of the antigens used in immunohistochemistry (IHC) are CD markers. For example, CD15 and CD30 can be used to identify Hodgkin’s disease, while CD20 and CD3 can be used to differentiate between B-cell lymphomas and T-cell lymphomas, respectively.

Figure 2. Classical Hodgkin’s lymphoma with RS cells positive to CD30 (Golgi-stain) CD15 (membrane) and negative to CD45 in RS cells and positive in reactive background.
Ramos, Patricia & Díaz-Sámano, Fernanda & Quiñonez Urrego, Enoe. (2016). Archives of Hematology Case Reports and Reviews Diffuse Large B-Cell Lymphoma and Classical Hodgkin´S Lymphoma Converge in an Unusual Presentation as a Gastric Composite Lymphoma: Case Report. Archives of Hematology Case reports and Reviews. 1. 001-002. 10.17352/ahcrr.000001.
Spatial Phenotyping
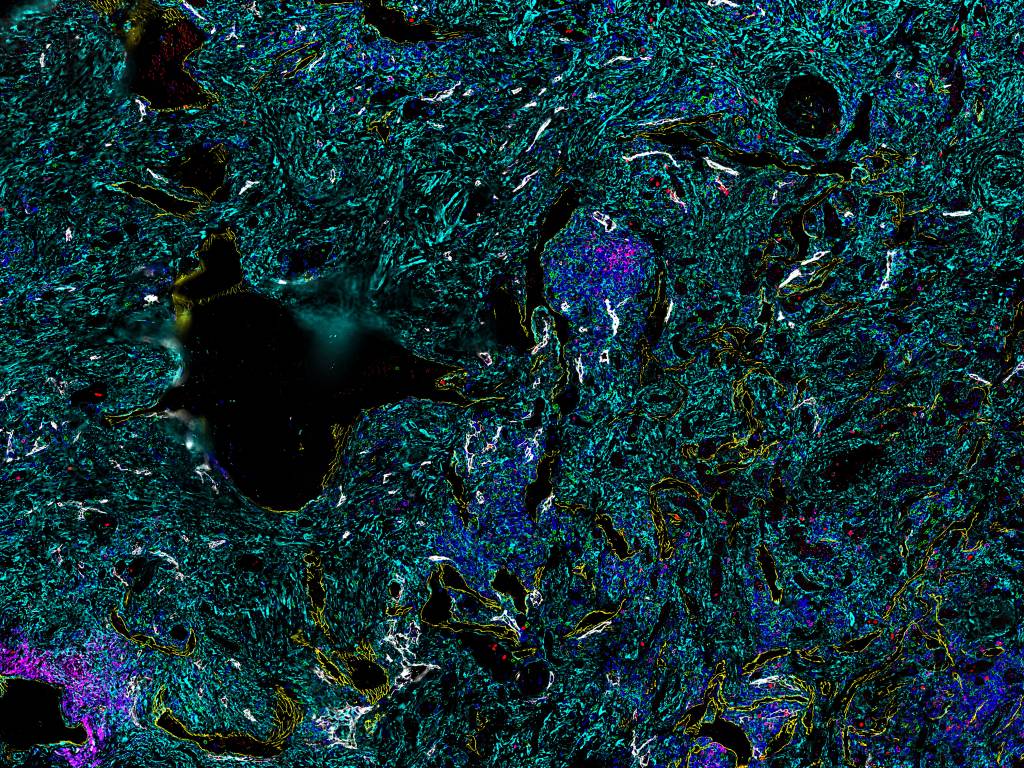
Spatially resolved, highly multiplexed biomarker analysis (spatial phenotyping) is being used to analyze the interactions between neighboring cells or groups of cells that are key to important biological processes. This analysis of context frequently involves the use of CD markers — for example, determining the difference between a CD4 T cell in breast cancer tissue surrounded by CD8 T cells to a CD4 T cell surrounded by luminal epithelial cells.

Figure 3. Sample image for spatial phenotyping of renal cell carcinoma tissue stained for 7 different markers including Ki67, CD8, CD4, Podo, SMA, CD20, and CD31.

